Thursday, June 20, 2013

HLS Law Enforcement: Participation Activity

In the article, A Better Method to Smooth Crime Incident Data, crime data from the New York City Police Department On-Line Complaint System is used to compare the differences between methods of kernel estimation. Kernel estimation is the spatial statistical method used to generate density maps. Police departments use crime density maps to identify crime hotspots and plan patrol schedules, so it is important that the map is as accurate as possible. In this week's lab we used crime data from Washington DC to generate crime density maps and propose a location for a new police station. The kernel estimation method used in the lab was based on the areal extent of Washington DC. However, as this article points out, there is a more accurate method for kernel estimating.

Kernel smoothing estimates the variation in density of events based on a point pattern, resulting in a map of smooth density values. Kernel estimation is successful in making sense of complex point patterns. The most important step in kernel estimation is selecting the bandwidth. Maps generated with a small bandwidth are spiky in appearance, and those maps generated with a large bandwidth appear smooth and generalized. As with either method, density maps can then be used to create other datasets for further analysis.

Most GIS programs base its kernel estimation on the areal extent of the event data without considering the spatial distribution of the points. The result is large bandwidths being selected for small sample sizes and small bandwidths for the large. This article proposes selecting the bandwidth based on a predetermined number of points, or neighbors, represented by the variable 'k' called the k-nearest neighbor method. This method bases the bandwidth on the average distances between the event data. Varying the value of 'k' allows the GIS analyst to specify the degree of smoothing which reveals the previously unrealized variation in density across the study area. This added capability must be used with caution though, as the user defined input can still result in a misleading or inaccurate map.

http://www.esri.com/news/arcuser/0199/crimedata.html

Saturday, June 15, 2013

Python Fundamentals II

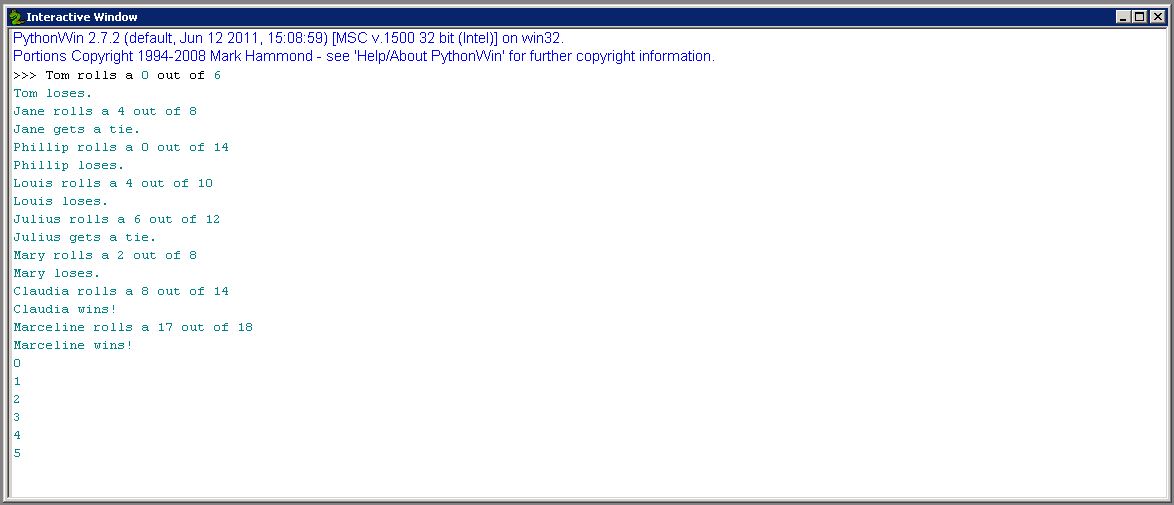
Python Dice Game Result 

The result of this script lists eight players with their score from the roll of a dice and whether or not they are a winner. The list of numbers at the bottom are the result of a while loop counting from zero to five.

Thursday, June 13, 2013

Hurricanes

 Hurricane Sandy 2012

This map charts the track of Hurricane Sandy displaying wind speed and pressure along the way. States that made disaster declarations with FEMA are represented as well.

Hurricane Sandy 2012 Damage Assessment

This map shows pre and post storm imagery of a small section of the New Jersey shore. Structure damage points were placed over each parcel and then classified by comparing the two sets of imagery.

Wednesday, June 5, 2013

Python Fundamentals I

Successful Result

This is a screen shot of a script result that displays my last name. Then it calculates the length of my last name and displays the result multiplied by 3.

Tuesday, June 4, 2013

Japan Tsunami Lab

Fukushima Evacuation Zones


This week I created a File Geodatabase with Feature and Raster Datasets. I populated the datasets with shapefiles and DEMs of North East Japan. I also created a point feature class for Japan Cities from XY coordinate data in an Excel spreadsheet. This map was then created to show the evacuation zones in relation to the Fukushima II Nuclear Power Plant. 

Tuesday, May 28, 2013

Geoprocessing in Arc

Soil Erase Script Output


This simple image is the result of a model created in ModelBuilder. The model was designed to exclude soil, previously identified as not prime farmland, from a given basin.

Lahars

Lahar Inundation Areas


Using two USGS 30 meter DEM's, the rivers shown here were extrapolated using a few tools in ArcMap's Spatial Analyst extension. These rivers can then be used to locate potential lahar inundation areas and as a tool in hazard assessment.

Lahar Hazard Assessment


This map identifies at risk population by US Census block groups and schools within a half mile of streams and rivers located on Mt Hood. In the event of a volcanic event, these areas have the highest probability of being impacted by lahars.