Showing posts with label Intro to GIS. Show all posts

Thursday, May 2, 2013

Final Project: Presentation

Bobwhite-Manatee Transmission Line Right-of-Way Acquisition

You will find my final project for Into to GIS at the links below, Enjoy.


Wednesday, April 10, 2013

Georeferencing, Editing & ArcScene

 UWF Campus with Bald Eagle Protection Area

This map of the UWF Campus shows two rasters that were georeferenced using UWF building polygons. Once georeferenced, I was able to edit the UWF buildings and UWF roads layers adding a new gym and road segment. The protection area was created using the Multiple Ring Buffer tool to add a 330' and a 660' ring around an active Bald Eagle nest near the campus.

UWF Campus in 3D

This 3D map was created in ArcScene using the same data from the previous map above. A DEM was included to provide ground relief and the buildings were extruded based on their height. A vertical Exaggeration of 5 was applied to help the map appear more 3D.

Thursday, April 4, 2013

Geocoding & ModelBuilder

Lake County, Florida: EMS Locations with Optimized Route


This weeks lab took us through Geocoding, Network Analysis and ModelBuilder. I created this map from a TIGER/Line Edge Shapefile downloaded from the US Census Bureau's website. We were provided with a list of addresses for EMS locations within Lake County, Florida. I Geocoded the list using an address locator I created using the Census data. The Optimized Route was calculated using Network Analyst from Stops that I placed at random locations.

Wednesday, March 27, 2013

Vector Analysis 2

Potential Campsite Areas in Desoto National Forest


For this map, I utilized the buffer tool along with a couple of different overlay analysis tools to create a feature class showing the areas within the Desoto National Forest that are suitable for campsites based upon a specific set of criteria.

Thursday, March 7, 2013

GIS Data Search

The goal for this weeks lab was to find the data for ourselves and then reproject it when necessary. The data for the following maps was retrieved from the Florida Geographic Data Library and the Florida Department of Environmental Protection's Land Boundary Information System.

Land Cover and DEM with Invasive Plants

This map shows two environmental characteristics of Hendry County, Florida. On the left, the county's Land Cover is classified by the value assigned to each category of plant species. The attribute table for this data includes a more meaningful description for each category, however the resulting legend would encompass an entire page. On the right is a DEM with an overlay of Invasive Plants clipped to the extent of the county boundary.

Public Land and Hydrography with Aerial Quarter Quad Inset

This map shows publicly owned land according to the Hendry County Property Appraisers Office. I chose to display this data by governing entity. I limited the hydrography data to only a few categories so it wouldn't clutter the data frame. I used the aerial quarter quad as an inset map where I changed the road labels and scale bar to a contrasting color.

Thursday, February 28, 2013

Oceania World Heritage Site


The UNESCO World Heritage List is comprised of sites considered to have outstanding universal value.  The sites are chosen due to their cultural and natural heritage.  The following map gallery was created to share some of the World Heritage sites for the Asia/Oceania zone.  There are ten sites mapped including: archaeological sites, marine protected areas, diverse landscapes, protected wildlife zones, and unique geological formations.  The maps were created using ArcGIS online.  Included with the maps, visitors will find links to additional interesting information about the sites. This map gallery can be accessed at: http://goo.gl/fl0JN
This map gallery should not be considered a comprehensive review of the UNESCO World Heritage sites in Oceania. Rather, it should be viewed as a compilation of some of the interesting sites within that area. For more detailed and expansive information, one should view the UNESCO World Heritage list: one of the main resources used in building this map gallery. We sincerely hope you enjoy it.

Wednesday, February 20, 2013

Projections Part 2

I created this map from sample point data provided in an Excel document. I used Excel to convert coordinates from Degrees Minutes Seconds to Decimal Degrees, then I added the data to ArcMap where I created a new Shapefile. After that I downloaded the remaining layers from LABINS and FGDL which had to be reprojected to match the aerials that are in State Plane Florida North.

Tuesday, February 12, 2013

Projections Part 1

This map was created to show how the same data, if drawn in different projected coordinate systems, can be distorted. It's important to know whether or not if your data's coordinate system is defined and to reproject it when necessary.

Sunday, February 3, 2013

ArcGIS Online and Map Packages

This week in Intro to GIS was mostly a refresher for me as the class was introduced to ArcGIS Online and ArcGIS Explorer Online. We started the week at ESRI's Virual Campus and completed their course, "Authoring Web Maps Using ArcGIS Online". Then we and worked half way through "Creating and Sharing Map Packages for 10.1". I learned the differences between a Map Package and a Tile Package and the best use of each. I had never shared a Map Package to my ArcGIS Online account before a was amazed at how simple it was. Up until this week I had only shared some maps that I created in the map viewer using map services that are being consumed on a few webpages. I am already working on some scenarios where sharing Map Packages will make my work flows more efficient.

Friday, January 25, 2013

GIS Cartography

States of Mexico by population

This map of Mexico displays the population density of each state within the country. Neighboring countries are also labeled with a subdued font as to not detract from the maps purpose.

Urban Centers of Central Mexico

This map of central Mexico shows urban areas, those with a population greater than 1 million are labeled. The map also displays railroads and federal highways as well as primary and major rivers. I changed the symbology in the legend to correlate more with the layer. I also added an inset map with an extent indicator.

Topography of Mexico

This is a simple topographic map of Mexico. The legend indicates the elevation in meters relative to sea level. I experimented a bit with the inset map properties and decided it looked good with a drop shadow; the legend probably could benefit from the same effect. I changed the background on this map to a blue and added some text to identify the Pacific Ocean and the Gulf of Mexico.  


Thursday, January 17, 2013

Own Your Map


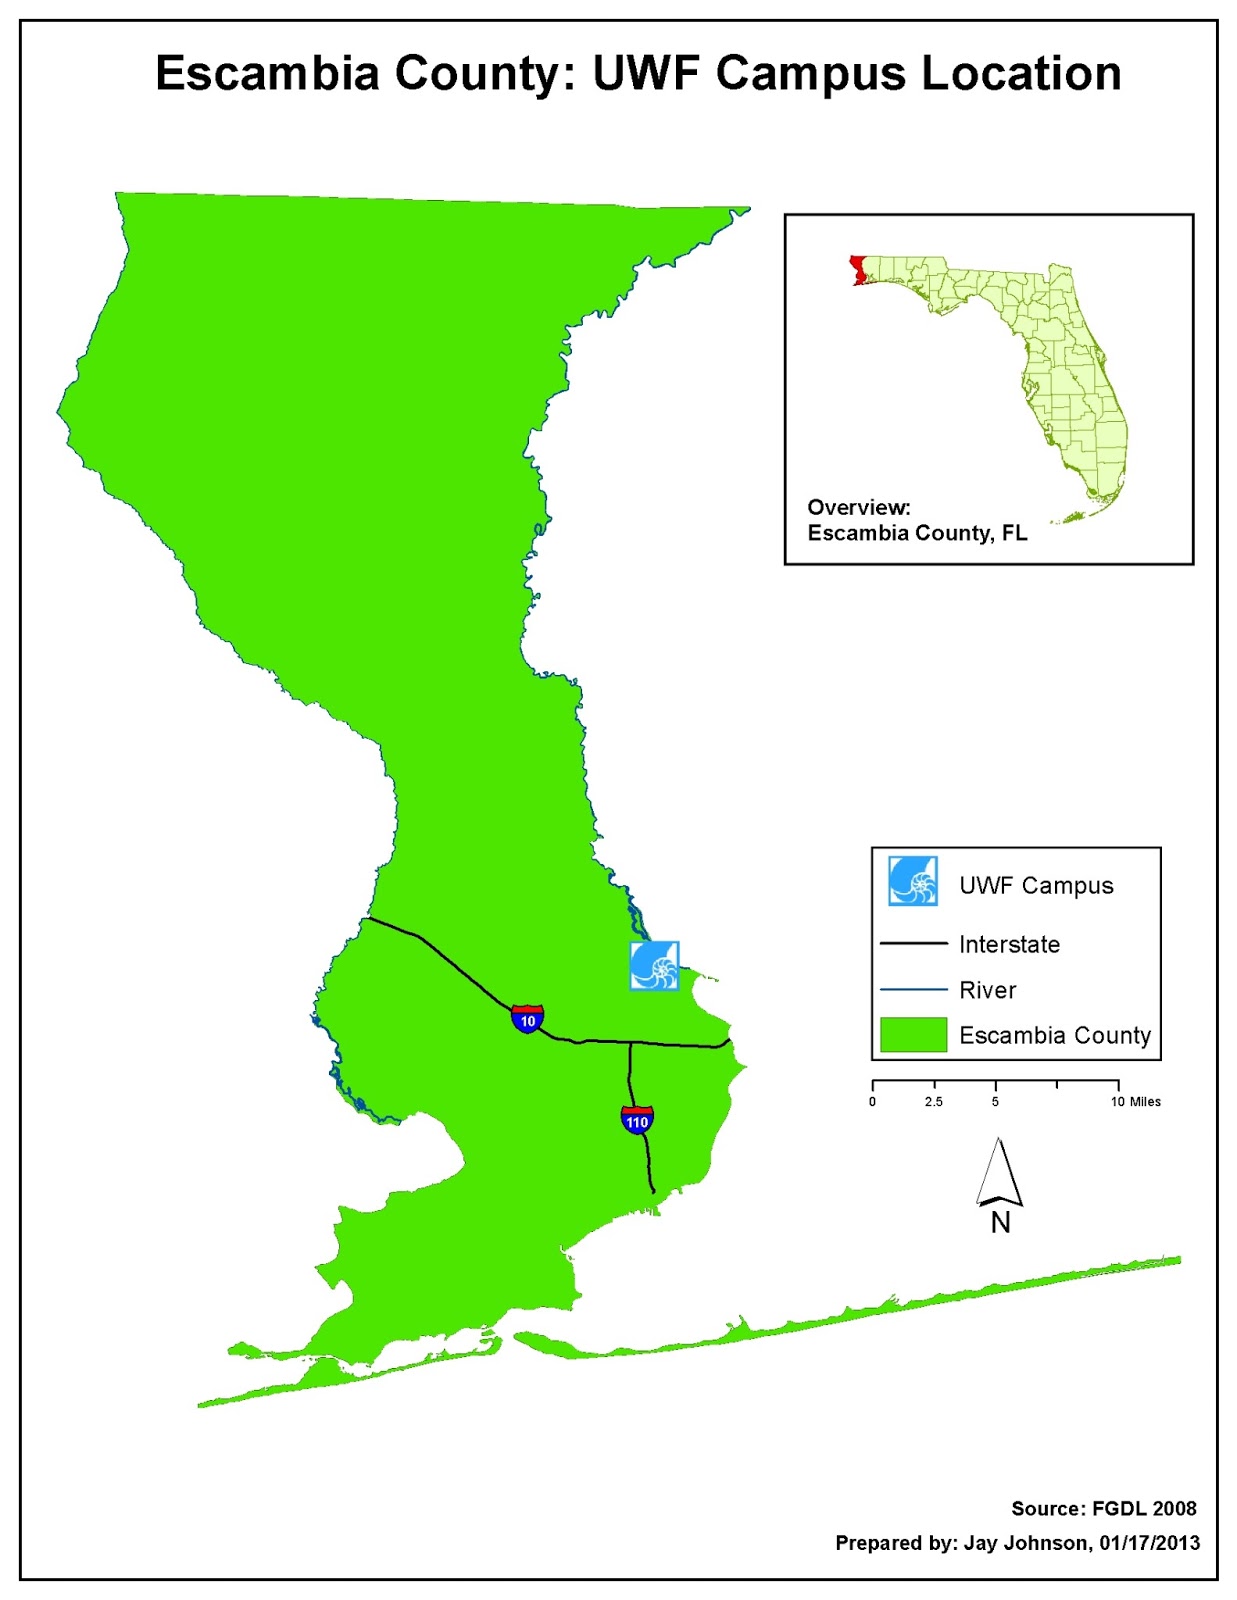
This map shows the general location of the UWF campus in Escambia County. I created a custom marker symbol using the UWF logo from the school's website.

Thursday, January 10, 2013

Overview of ArcGIS


My First Map

This is a thematic map of the world based on the country's population; dark green the least populated, red being the most.